Session Number: 5
Session Title: Measures of Economic Well-Being
Paper Number: 2
Session Organizer: Andrew Sharpe
Discussant: Thesea Garner
Paper prepared for the 26th General Conference of
The International Association for Research in Income and
Wealth
Cracow, Poland, 27 August to 2 September 2000
Time and Economic Well-Being
Joachim Merz
For additional information please contact:
Prof. Dr. Joachim Merz, University of Lüneburg, Department
of Economic and Social Sciences, Research Institute on Professions (FFB), Campus
Scharnhorststr. 1, Geb. 5, 21335 Lüneburg, Germany, Tel: +49 (0)4131/78-2051,
Fax: +49 (0)4131/78-2059,
e-mail: merz@ffb.uni-lueneburg.de, http://www.uni-lueneburg.de/fb2/ffb
This paper is placed on the following websites:
www.stat.gov.pl
www.econ.nyu.edu/dept/iariw
Time and Economic Well-Being
A Panelanalysis of Desired vs. Actual Working Hours
Abstract
Individual well-being is restricted by and has its ressources by income and
time. Though income traditionally is on the focus of well-being analyses, the
connected time dimension is at least often neglected. One important dimension of
individual welfare regarding time and income is on the possibility to harmonize
desired with actual working hours connected with the income dimension. This
paper will analyze this working hour tension by a ten years panelanalysis for
Germany. Besides descriptive measures of the subjective tension over a decade
from the mid 80s to the mid 90s, the paneleconometric analyses will quantify
personal and household influences in explaining the working hour tension as one
further important economic well-being measure.
Keywords: Time use, well-being, labour market dynamics, working hour
tension, desired and actual working hours, paneleconometric analyses,
professions, entrepreneurs and employees
________________________
The assistance of Dipl.-Volkswirt Rainer Lang and stud. rer. pol. Olaf Loest is gratefully acknowledged.
Time and Economic Well-Being
A Panelanalysis of Desired vs. Actual Working Hours
Joachim Merz
1 Time and Economic Well-Being Introduction
2 Time and Economic Well-Being: The Empirical
Operationalization
2.1 Microdatabase: The German Socio-Economic Panel
(GSOEP)
2.2 Desired and Actual Working Hours and Economic
Well-Being Questionnaire
2.3 General Definitions for Our Cross-Sectional and
Longitudinal Microanalyses
3 Desired vs. Actual Working Hours in the 80s and 90s
Working Hour Tension Cross-Sectional Evidence
3.1 Employment Structure Development, Part-Time and
Full-Time Work 1985 and 1994
3.2 Part- and Full-Time Desired and Actual Working Hours
1985 and 1994
3.3 Desired vs. Actual Working Hours 1985 and 1994:
General Results
4 On the Individual Process of Harmonization of Desired
and Actual Working Hours During a Decade A Panelanalysis of Individual
Longitudinal Developments
4.1 Mover and Stayer: Mover Indices from 1985 to 1994
4.2 Further Transitional Aspects for Professions,
Entrepreneurs and Employees
5 What Explains the Working Hour Tension:
Paneleconometric Estimates
5.1 The Paneleconometric Approaches: Pooled, Fixed and
Random Effects One and Two Factor Models
5.2 The Set of Explanatory Variables: Market and
Non-Market Influences
5.3 Male and Female: Are there Genderspecific Differences
in Explaining the Working Hour Tension?
5.4 Professions, Entrepreneurs and Employees: Are there
Specific Occupational Differences in Explaining the Working Hour Tension?
5.5 Wage Elasticities on the Working Hour Tension of
Professions, Entrepreneurs and Employees
5.6 Under- and Overemployed: Are there Different
Explanatory Patterns?
5.7 A Global Approach: Results of the Random Effects Two
Factor Panel Model
6 Concluding Remarks: Some Economic Policy Implications
and Concluding Remarks
References
Appendices
Time and Economic Well-Being
A Panelanalysis of Desired vs. Actual Working Hours
Joachim Merz
1 Time and Economic Well-Being Introduction
Individual (economic) well-being is restricted by and has its
ressources by income and time. Though income traditionally is on the
focus of well-being analyses, the connected time dimension2 is at least often
neglected. One important dimension of individual welfare regarding time and
income is on the possibility to harmonize desired with actual working hours
connected with the income dimension. This paper will analyze this working hour
tension by a ten years panelanalysis for Germany.
In our paper we investigate labour market dynamics according
this individual time balance of active people with focus on the self-employed,
as professions and entrepreneurs, and employees. The individual longitudinal
analysis based on panel data allows to follow the process of working time
preferences and actual outcomes and its individual convergence/divergence
process in the course of time. Our results quantify the working hour tension
developments in a decade from the mid 80s to the mid 90s based on the German
Socio-Economic Panel with ten waves from 1985 to 1994. Besides descriptive
measures of the subjective tension over a decade from the mid 80s to the mid
90s, the paneleconometric analyses will quantify personal and household
influences in explaining the working hour tension as one further important
economic well-being measure.
Questions Behind
Facing still a problematic labour market situation with high unemployment and an ongoing discussion about international competitivenes, cost pressure, personal reduction and shareholder values questioning the individual satisfaction about the working time of the active people - at a first glance - seems to be of minor priority. However, there are a number of reasons why the working hour tension (the difference between desired and actual working hours) of the active people is important, for the active people themselves, certainly for the unemployed with their desire to work anyhow and for an enterprises success.
At the micro level it is pinpointed that working productivity is dependent on the working satisfaction including the satisfaction concerning the balance of actual and preferred working hours. Just because in times of high unemployment, labour market pressures lead to a growing individual overtime situation reasoning social conflicts and stress. With the perspective of the working individual, the amount of the working hour tension describes the degree of job satisfaction with all its consequences on the individuals living circumstances according to non-material spheres like health, partnertship etc. and according to the individuals material conditions of the standard of living and economic well-being, the more, the more this tension is connected with the money part of the income situation itself.
Solving labour market issues on a macro level, a policy with diminishing individual working hours in favour for new jobs was a central claim of the German unions not only in the 80s. In the 90s it is still an open question of economic and social policy how to handle the labour market problems (Holst and Schupp 1994). Is there any individual willingness for a redistribution of working hours by working less? And if, is there any changed behaviour in the course of time and changing circumstances for men and/or women? Is there an expansion of part-time occupation from the 80s to the 90s and how is the development of full-time occupation in this decade? Furthermore: Do full-time occupied persons prefer working part-time; are part-time workers satisfied with their working hours or do they want to work longer?
If any economic and social policy, and in particular, any labour market policy - as by raising or diminishing working hours, flexibility with regard to part-time and full-time jobs etc. - shall be based and burdened by the persons concerned, the knowledge about the individual judgement of their working hours and their preferences on the background of the actual situation is essential - in a longitudinal view accounting for different macro situations, in particular. And, more general, such an empirical based knowledge is essential for any successful economic and social policy orientated on the individual desires.
Very connected with the above arguments and new labour market forms and individual well-being is the question of time souvereignity as being self-employed or employed: Does working time souvereignity really lead to a satisfied balance of the desired and actual hours of work? Thus, one important socio-economic breakdown in our analysis will be the occupational status as self-employed (as professions (Freiberufler) and entrepreneurs) and employees. In addition, changing individual working hours pattern will influence and will be dependent on the living conditions and labour force situation of the entire household an individual is situated in.
Alltogether, with our topic and paper on time and economic well-being we add an important aspect to the traditional income centered inequality and welfare discussion in economics taking into account the necessary amount of scared individual time to broader the individual living conditions and standards.
Papers Organization
To deal with the above questions and problems we analyze the individual working hour tension of the active people based on a relatively ambitious longitudinal microdata base. We first characterize the data base: the German Socio-Economic Panel as our ten years base, describe the empirical operationalization of time use as desired vs. actual working hours and the connected economic well-being, and give general definitions for the following analyses.
The substantial part 1 is analyzing working hour (including part- and full-time) preferences and the actual situations before and after a decade with two respective cross-sections of the mid 80s (1985) and the mid 90s (1994). We discuss the genderspecific development in part-time and full-time occupation in general and the respective working hour tension in particular. Further distributional aspects show the spread of tension for different part-time and full-time employment situations.
The two cross-sections show the situations as two snapshots for allover Germany, including East-Germany 1994 in particular. Though macro developments as some saldo-effects can be shown by this type of analysis, however, the individual changings and developments are still hidden. Therefore we extend the analysis by individual longitudinal developments with our panel data which describe the process of the working hour tension on the individual level. In addition to the descriptive transition analysis we quantify socio-economic influences (including individual domestic (non-market) working pattern and the further household situation) by multivariate panel econometric estimates.
We estimate fixed and random effects models and compare the results to a pooled model. In addition, we estimate two factor fixed and random effects models to further disentangle individual and time period effects. The paneleconometric analysis with ten years individual developments show the importance of singular explanatory factors in competition to other explaining patterns. In particular, we quantify market and non-market influences on the working hour tension. Only this kind of information allows any economic and social policy to effectively target individual behaviour with some chances of success.
In the conclusion we discuss some impacts of our results for economic and social policies and labour market strategies.
2 Time and Economic Well-Being: The Empirical Operationalization
To analyze our topic on an individual level an ambitious
database is necessary: we need the tight empirical connection between time use
as desired vs. actual working hours and economic well-being and we need
paneldata naturally for both the working hour tension as the endogeneous
variable as well as a set of socio-economic background variables to explain the
instant. Such a microdatabase is at hand: the German Socio-Economic Panel
(GSOEP) with its specific question on desired working hours and the further
background.
To describe the empirical operationalization in this section
we briefly characterize our ten years panel-microdatabase, describe the central
question of investigation and set the general definitions for our
cross-sectional and longitudinal analyses.
2.1 Microdatabase: The German Socio-Economic Panel (GSOEP)
The German Socio-Economic Panel (GSOEP) is a longitudinal microdatabase containing socio-economic information on private households in the Federal Republic of Germany. The representative sample of households, persons and families is repeated yearly since 1984. All adult persons in a household aged 16 years and older (Germans, foreigners and institutional population) are surveyed. Since 1990 the GSOEP has been expanded with regard to the former German Democratic Republic (by 4.453 persons in 2.179 households). The first wave in 1984 consisted of merely 6.000 households with more than 12.000 persons interviewed. With demographic information, the household situation, individual labour force participation and occupational mobility data, the GSOEP questionnaire contains objective measures like use of time, wages, income components, benefit payments etc. as well as subjective measures such as level of satisfaction with various aspects of life, hopes and fears, political involvement etc. of the German population (Wagner et al. 1991). An English version of the GSOEP is available at Syracuse University (Burkhauser and Wagner 1996).
2.2 Desired and Actual Working Hours and Economic Well-Being Questionnaire
Time use information is available from the GSOEP within
different approaches. There is a normal day time-budget question with stylized
time information for several market and non-market activities (household,
child-caring, do-it-yourself, leisure etc.). There are frequency information for
different activities, and there are direct questions concerning the working
hours situation.
We are focussing our analysis on the following two working
hour questions (here from wave 11 (K, 1994) kp60 and kp66):
Thus, the desired hours question is linked to an appropriate wage compensation. The answer therefore is the the result of the individual valueing of the substitution and opposite income effect of working hour changings accounting for the income respective economic well-being consequences. We shall define the difference between desired or preferred working hours and the actual working hours as the working hour tension (wht=desired minus actual working hours). Since the question concerning preferred working hours was first asked in 1985, our analysis starts with the second wave.
2.3 General Definitions for Our Cross-sectional and Longitudinal Microanalyses
One of our interests is to analyze whether the possibility to
change the working hours by yourself or not (time souvereignity) is of influence
with regard to the working hour tension. We therefore divide our socio-economic
groups in self-employed professionals (Freie Berufe as architects,
lawyers, doctors, consultants etc.), entrepreneurs (self-employed up to and with
more than nine employees, without farmers, without the assistance of family
members) and employees (civil servants, blue- and white-collar workers). We
discard the unemployed, since their wish to work (more) is obvious; they may
benefit from a working hours reduction of the active people overall.
Additionally, in the longitudinal section we concentrate on
the harmonization process within the same occupation not to be disturbed by new
jobs specific requirements. Thus, there will be no occupational mobility but
the same occupational position ten years after (longitudinal section).
In general, our descriptive analyses are based on weighted
data with a specific refinement of the adjustment for the self-employed (Merz
and Lang 1997, Merz 1993, 1994). All paneleconometrics are based upon the
unweighted cases.
3 Desired vs. Actual Working Hours in the 80s and 90s Working Hour Tension Cross-Sectional Evidence
Let us start and look to the overall employment structure in the mid 80s (1985) - and ten years later in the mid 90s. With two snapshots, two cross-sections, we show the West-German situation in the 80s and after the reunification the situation in the 90s including East Germany. Thus quite a different labour market situation is to be expected for a changing Germany. More than 5300 persons (weighted: 21 Mio.) build the 1985 database, more than 6300 interviews (weighted 29 Mio.) are available for 1994.
3.1 Employment Structure Development, Part-Time and Full-Time
Work 1985 and
1994
We start our analysis with a description of the overall
employment development as the general labour market background for our further
working hour tension analyses. The genderspecific focus will be on the two main
working time schedules: full-time and part-time work. The question is whether
there is a more or less stable situation in between these two groups or whether
there is a changing over the regarded decade. A more flexible labour market
from the supply as well demand side - would probably result in an increased part
of part-time work.
Table 1 describes the genderspecific development in part- and
full-time occupation from the mid 80s to the mid 90s.
The overall development shows the same magnitude of full- and
part-time occupation increase by 37%; thus there is no remarkable change in
between the part-time and full-time pattern: overall 17,8% in both years are
working part-time. However, there are remarkable genderspecific differences.
More than each third women is working part-time whereas only about 4,4% of men
have such a job in 1994. The remarkable labor force participation increase of
women by 55% from the 80s to the 90s is mainly due to an increase of full-time
jobs (58%) followed by almost 50% increase of part-time labour force
participation. There is practically no changing of mens part-time situation
but an increase of about 30% in full-time occupation.
There are different dynamics with regard to the occupational
status: Professions by women have more than doubled (Index: 230%) whereas
the entrepreneurship-situation show only an increase by 7% (women) and 2% for
men. Professions show the highest part-time quota of all occupation (men and
women) for both years. Entrepreneurs: part-time is increased, full-time
is slightly diminished for men and women. Employees: whereas professions
and entrepreneurs are still a male domain, the women working quota is highest
within the employees.
To summarize: there are remarkable changes in the employment
structure with different dynamics in female and male labour force participation.
Womens part-time and full-time labour force participation have increased more
than mens participation. The labour force participation of women increased in
particular as professions. Whereas the overall part-time picture (17,8%) is
unchanged, there are remarkable shifts at least for the socio-economic groups
analyzed here with particular dynamics in the labour force participation of
women.
3.2 Part- and Full-Time Desired and Actual Working Hours 1985 and 1994
Is the changing labour force situation shown above acompanied by a more or less satisfied individual situation in Germany? Is there a changing of preferences from economically better times in the 80s to the tougher situation in the 90s? Is the labour market flexible enough to
Table 1: Employment Structure: Genderspecific Development in Part- and Full-time Occupation 1985 and 1994
|
|
1985 |
1994 |
Development-Index |
|||||||
|
All |
Men |
Women |
All |
Men |
Women |
All |
Men |
Women |
||
|
Professions 1) |
1,3 4) |
75,9 |
24,1 |
1,6 |
65,7 |
34,3 |
162,2 |
140,5 |
230,7 |
|
|
part-time (< 35 h) |
31,6 5) |
20,5 |
66,2 |
36,3 |
20,5 |
66,7 |
186,9 |
140,3 |
232,3 |
|
|
full-time (ł 35 h) |
68,4 |
79,5 |
33,8 |
63,7 |
79,5 |
33,3 |
150,9 |
140,5 |
227,4 |
|
|
Entrepreneurs 2) |
6,1 |
75,5 |
24,5 |
4,6 |
74,4 |
25,6 |
103,3 |
101,9 |
107,8 |
|
|
part-time (< 35 h) |
17,0 |
10,2 |
37,9 |
20,5 |
12,0 |
45,2 |
124,5 |
119,7 |
128,5 |
|
|
full-time (ł 35 h) |
83,0 |
89,8 |
62,1 |
79,5 |
88,0 |
54,8 |
99,0 |
99,9 |
95,2 |
|
|
Employees 3) |
92,6 |
61,5 |
38,5 |
93,8 |
57,0 |
43,0 |
139,3 |
129,1 |
155,6 |
|
|
part-time (< 35 h) |
17,7 |
5,1 |
37,7 |
17,4 |
3,6 |
35,7 |
137,1 |
90,2 |
147,2 |
|
|
full-time (ł 35 h) |
82,3 |
94,9 |
62,3 |
82,6 |
96,4 |
64,3 |
139,8 |
131,2 |
160,7 |
|
|
Gainful Employed 1)-3) |
21.025.587 |
13.143.854 |
7.881.733 |
28.894.480 |
16.730.395 |
12.164.085 |
137,4 |
127,3 |
154,3 |
|
|
part-time (< 35 h) |
3.746.458 |
751.740 |
2.994.718 |
5.154.523 |
729.487 |
4.425.036 |
137,6 |
97,0 |
147,8 |
|
|
full-time (ł 35 h) |
17.279.129 |
12.392.114 |
4.887.015 |
23.739.957 |
16.000.908 |
7.739.049 |
137,4 |
129,1 |
158,4 |
|
|
Source: German Socio-Economic Panel (GSOEP), weighted
cross- n1994 = 6.331, N1994 = 28.894.480 |
1) Self-employed professions |
|||||||||
Table 2: Part- and Full-Time Desired and Actual Working Hours 1985 and 1994
| 1985 |
Desired Working |
1994 |
Desired Working Hours 4) |
||||||
|
Actual Working Hours 4) |
N |
% |
part-time |
full-time |
N |
% |
part-time |
full-time |
|
|
Professions 1) |
281.429 |
1,3 |
31,5 |
68,5 |
456.561 |
1,6 |
36,8 |
63,2 |
|
|
part-time |
88.806 |
31,6 |
63,8 |
36,2 |
165.957 |
36,3 |
86,3 |
13,7 |
|
|
full-time |
192.623 |
68,4 |
16,7 |
83,3 |
290.604 |
63,7 |
8,6 |
91,4 |
|
|
Entrepreneurs 2) |
1.282.660 |
6,1 |
19,0 |
81,0 |
1.325.590 |
4,6 |
19,4 |
80,6 |
|
|
part-time |
217.899 |
16,0 |
70,1 |
29,9 |
271.376 |
20,5 |
67,2 |
32,8 |
|
|
full-time |
1.064.761 |
83,0 |
8,6 |
91,4 |
1.054.214 |
79,5 |
7,1 |
92,9 |
|
|
Employees 3) |
19.461.498 |
92,6 |
28,2 |
71,8 |
27.112.329 |
93,8 |
27,8 |
72,2 |
|
|
part-time |
3.439.753 |
17,7 |
77,0 |
23,0 |
4.717.190 |
17,4 |
89,3 |
10,7 |
|
|
full-time |
16.021.745 |
82,3 |
17,7 |
82,3 |
22.395.139 |
82,6 |
14,8 |
85,2 |
|
|
Source: German Socio-Economic Panel (GSOEP), weighted cross- sectional datasets, own computations, n1985 = 5.307, N1985 = 21.025.587, n1994 = 6.331, N1994 = 28.894.480 |
1) Self-employed professions |
||||||||
allow the workload which is wanted? Table 2 shows the
congruence/divergence of part-time and full-time desires compared to the actual
situation 1985 and 1994.
The main result: the working hour preference strongly
correspond to the actual part-time and full-time situation (the block diagonals
are dominant). This correspondence is even stronger ten years later for
professions and employees with more than 85% satisfied with their part-time and
full-time situation. The block diagonal is dominant for entrepreneurs, too, with
67% part-time and 93% full-time satisfaction.
To summarize: The part-time/full-time threshold was and is
even stronger ten years later a dominant division of labour which is permanently
desired by the active people. For a further discussion of part-time in Germany
see Holst and Schupp 1994 and Schupp 1991.
3.3 Desired vs. Actual Working Hours 1985 and 1994: General Results
Now let us do into more detail and ask how the working hour
tension as measured as the relative (relative to the actual situation)
difference between desired and actual weekly working hours is gender- and
occupationspecific distributed according to the desire to work less (being
overemployed), to work the same (being satisfied) or to work more (being
underemployed).
The overall situation is as followed: In 1985 56% of all
working people want to work less, 32% are satisfied with their working hours
situation and 12% want to work more than they do (Table 3a). The stress, the
dissatisfaction overall has grown within the following decade: For the reunited
Germany now only 21% are balanced, more than 62% want to work less and 16% want
to work more. Thus, taking into account possible income reductions, the amount
of dissatisfied working people with the desire to diminish the working hours
(let us call it negative dissatisfaction), in particular, has grown in
Germany remarkably. This holds both for men and women with a slightly more
balanced situation in 1994.
This trend to an unbalanced and stressed situation, with
desires to work less in particular, is supported by the amount of the
discrepances between desired and actual working hours: Whereas in 1985 the
overall mean working hour tension (wht) was positive (9,3%), indicating on the
average dominant desired to work more than desired to work less hours, even the
sign has reversed in 1994 (mean wht: -2,9%). The mean actual working hours are
diminished over the decade by 0,7 hours ( = 42 minutes) roughly in the same size
for men and women.
Pronounced differences are given according to the
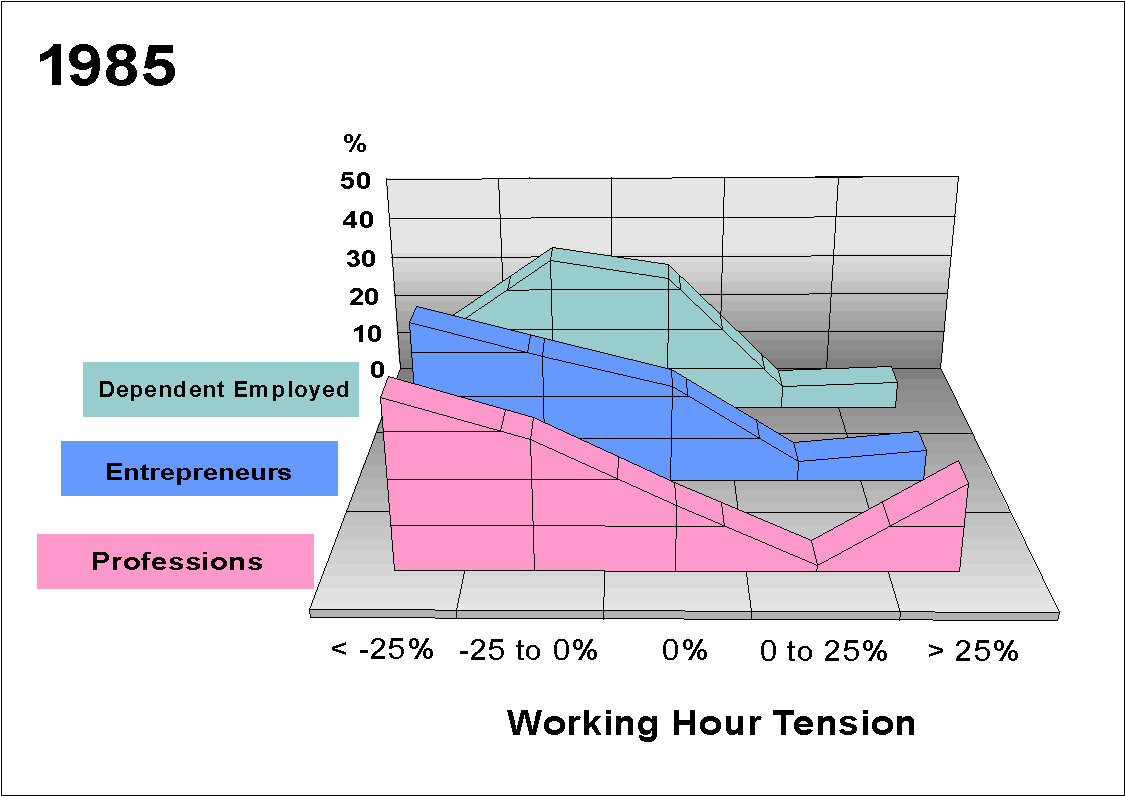
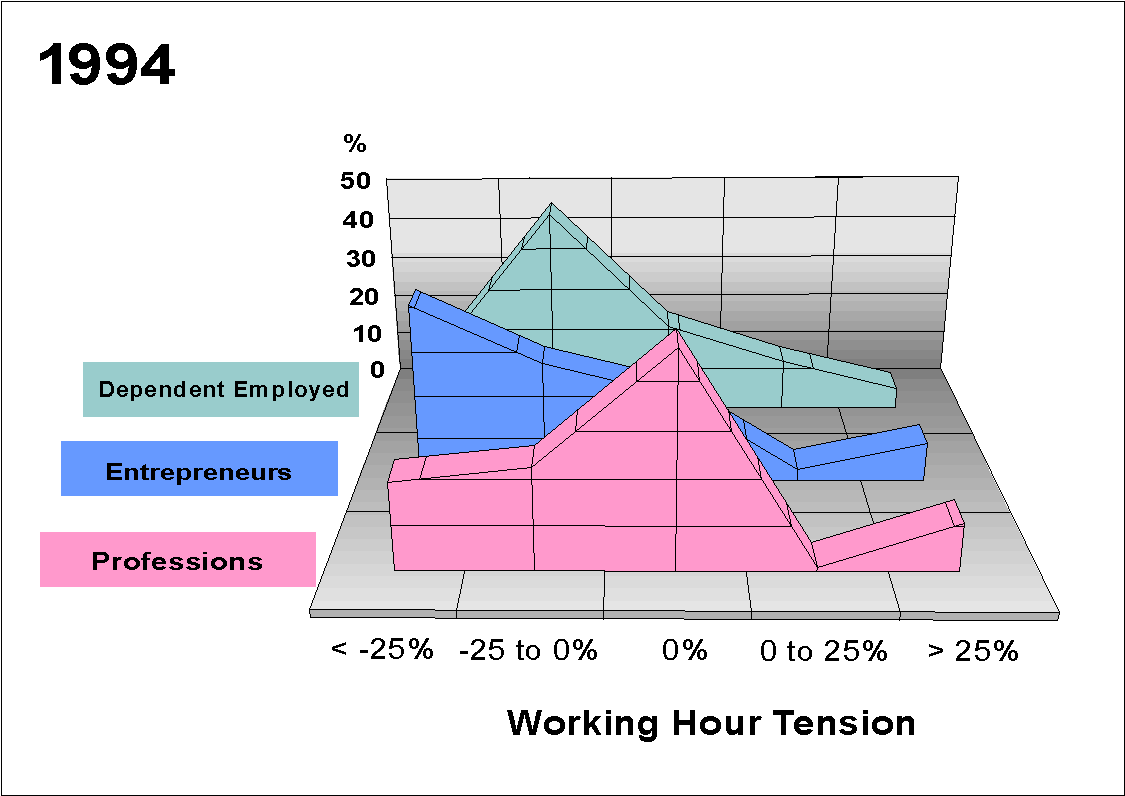
oocupational status (see Figure 1, too):
Employees: The proportion of the balanced situation
diminished from 32,8% to 20,9% mainly to the burden to the desire to work less
(negative dissatisfaction).
Entrepreneurs: The proportion of the balanced situation diminished only slightly from 22,1% to 20,4% with an increased proportion of being negatively dissatisfied (from 65,9% 1985 to 68,1% 1994).
Professions (Freie Berufe): The proportion of the balanced situation raised remarkably from 14,4% to 46,7% mainly with a diminishing proportion of people with desires to work less.
Thus, time souvereignity via the occupational status seems to
be an important factor for the working hour harmonization. In addition, the
group of professions seems to be most succesfull in reaching a balanced working
hour situation.
Obviously the amount of weekly working hours between these
occupational groups has a quite different level but is diminishing for all. More
distributional details according to the amount of
Table 3a: Desired vs. Actual Working Hours:
Overall and Gender- and Occupationspecific Working Hour Tension (wht)1) 1985 and 1994
|
1985 |
1994 |
|||||||||
|
Desire to work |
Mean |
Desire to work |
Mean |
|||||||
|
less |
same |
more |
wht |
working hour |
less |
same |
more |
wht |
working hour |
|
|
All Working |
56,1 |
31,9 |
12,0 |
9,3 |
40,1 |
62,4 |
21,3 |
16,3 |
-2,9 |
39,4 |
|
Men |
57,6 |
31,1 |
11,2 |
7,3 |
44 |
64,9 |
19,2 |
15,9 |
-5,4 |
43,5 |
|
Women |
53,6 |
33,2 |
13,2 |
12,8 |
34 |
58,9 |
24,2 |
17,0 |
0,6 |
33,6 |
|
Professions2) |
65,2 |
14,4 |
20,4 |
12,3 |
40,2 |
41,7 |
46,7 |
11,6 |
5,4 |
37,2 |
|
Men |
70,0 |
12,5 |
17,5 |
9,0 |
45,0 |
51,0 |
38,9 |
10,0 |
8,1 |
44,0 |
|
Women |
49,8 |
20,5 |
29,6 |
22,5 |
27,0 |
23,8 |
61,5 |
14,6 |
0,2 |
24,2 |
|
Entrepreneurs3) |
65,9 |
22,1 |
11,9 |
-4,9 |
52,3 |
68,1 |
20,4 |
11,6 |
-0,0 |
49,6 |
|
Men |
69,0 |
20,7 |
10,3 |
-5,0 |
55,0 |
75,2 |
14,4 |
10,5 |
-3,8 |
54,1 |
|
Women |
56,3 |
26,6 |
17,1 |
-4,7 |
43,0 |
47,4 |
37,8 |
14,8 |
10,9 |
36,7 |
|
Employees4) |
55,3 |
32,8 |
11,9 |
10,2 |
39,2 |
62,4 |
20,9 |
16,7 |
-3,2 |
38,9 |
|
Men |
56,5 |
32,3 |
11,2 |
8,3 |
43,0 |
64,5 |
19,1 |
16,4 |
-5,8 |
42,8 |
|
Women |
53,5 |
33,5 |
12,9 |
13,4 |
33,0 |
59,7 |
23,3 |
17,1 |
0,3 |
33,7 |
Source: German Socio-Economic Panel (GSOEP), weighted
cross-sectional datasets, own computations,
n1985 = 5.307, N1985 =
21.025.587, n1994=6.331, N1994 =
28.894.480
1) Working hour tension (wht) = (desired - actual weekly
working hours) / actual weekly working hours * 100
2) Self-employed professions
3) Self-employed without professions, without farmers and
without assistance of family members
4) Blue-collar workers, white-collar workers, civil
servants, without trainees
Figure 1: Desired versus Actual Working Hours 1985 and 1994
Source: German Socio-Economic Panel (GSOEP), weighted cross-sectional datasets, own computations (see Table 3a,b)
the working hour tension dependent on the part- and full-time
actual situation for 1985 and
1994 is given in Table 3b in the Appendix. As it will be evident from Table 3b,
the strongest (relative!) negative working hour tension, the strongest desire to
work less than actually done, are given for those who work the most with working
hours > 40 hours per week. Thus, it is not only time souvereignity as given
by the occupational status but also the level of actual working hours which is
important in explaining the working hour tension; a descriptive result which has
to be respected by the further inferential analyses.
Remember: The two cross-sectional snapshots shows a growing (,negative) dissatisfaction for employees and (less) for entrepreneurs. In particular, there is a growing balance of desired and actual working hours for professions.
These are descriptive results with very different cross-sections: 1985 West-Germany, 1994 West and East Germany. Thus many different processes and determining factors might play a role in explaining the changings of the time and well-being package. Therefore a careful multivariate is necessary for analyzing the significant explanatory pattern. We do this now in the second main part of our analysis with different panelanalysis and paneleconometric approaches.
4 On the Individual Process of Harmonization of Desired and Actual Working Hours During a Decade A Panelanalysis of Individual Longitudinal Developments
The two cross-sections of the above sections describe the general situation where a lot of different developments finally leads to a certain saldo of effects. In addition, the picture is influenced by the new situation within the Neue Länder where a brand new labour market is going to be settled. To disentangle those saldo effects paneldata in particular allows to follow the individual development. The following longitudinal analysis answers the question, whether it was able to harmonize desires with the actual situation on the personal, individual level within a decade from the mid 80s to the mid 90s in Germany.
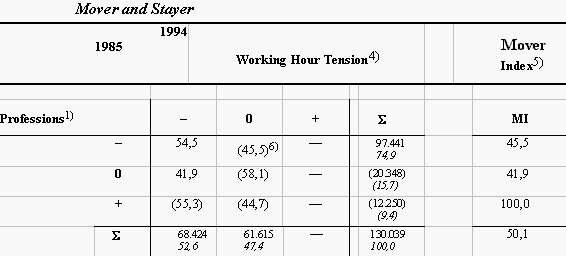
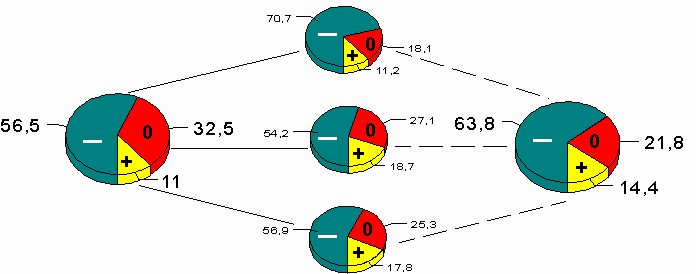
4.1 Mover and Stayer: Mover Indices from 1985 to 1994
To describe the individual convergence/divergence process in
the course of time from 1985 to 1994, the working hour tension process, among
others, is expressed by mover and stayer indices (MI) from a transition matrix
showing the individual developments. The mover index MI relates all movers from
the 1985 situation to all persons (movers and stayers) with respect to one of
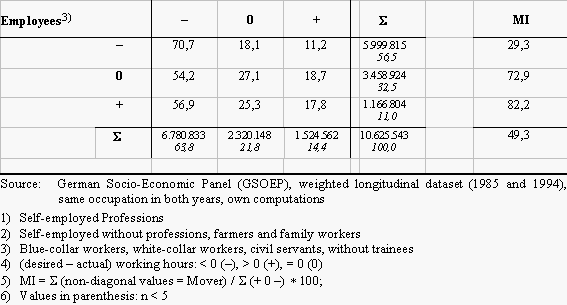
the three states (wht: negative, balanced, positive) (Table 4a).
We start with the employees development: With 82,2%
the most transitions are seen for those employees who wanted to work more in
1985. More than each second (56,9%) of them are dissatisfied (-) ten years
later. 72,9% leave their satisfied situation, 54,2% wish to work less ten years
after. Only 29,3% of the negatively dissatisfied (wht= -) employees were
able to balance (18,1%) respectively wish to work more within the course of
time.
Table 4a: Individual Longitudinal Changes in Working Hour Tension
Desired vs. Actual Working Hours 1985 to 1994:
Thus, the individual transition analysis of the employees
emphasizes the cross-sectional evidence with the stated process to
dissatisfaction and to work less accepting shortages in their income situation.
Note, all the individuals 1994 belong to the same occupational status as ten
years ago. Further movings out of the employee situation at all within the
decade even stronger express these labour market dynamics.
Employees face a contracted working hours situation which
might restrict the actual desires to change and might influence the as if
situation and answer. At least with regard to the contract situation the
self-employed have another kind of time souvereignity. Do they show a different
picture compared to the employees?
For entrepreneurs the picture to some extent is
similar to the employees development: the relatively most movers are from
those who starts with desires to work even more (MI+: 89,8%), followed by
balanced entrepreneurs with now desires to work less than they do (MI0: 72,8%).
Note, the different occupational groups might have another level of working
hours (in 1985 more than 72% entrepreneurs work more than 40 hours a week (mean
actual weekly working hours: 52,3 hours) compared to 41% employees (mean actual
weekly working hours: 39,2 hours); see Tables 3a,b); therefore we regard
measures realtive to the actual working hour situation.
Table 4b: Working Hour Tension1) Dynamics Individual
Longitudinal Changes
of Desired vs. Actual Working Hours 1985 to 1994
Mover Indices (MI in %)
For professions MI-: 45,5 % moved from the
overemployed to the balanced situation. In addition, 58,1% could stay in their
balanced situation. It is clear, that the relatively small groups of
self-employed in the population and thus in the sample, too, do not allow to
overinterpret the results. However, the differences between the professions and
the other groups are remarkable also in the longitudinal view with a growing
balanced situation of the professions. Thus, time souvereignity expressed by the
self-employed situation is a driving factor for the working hour tension
development.
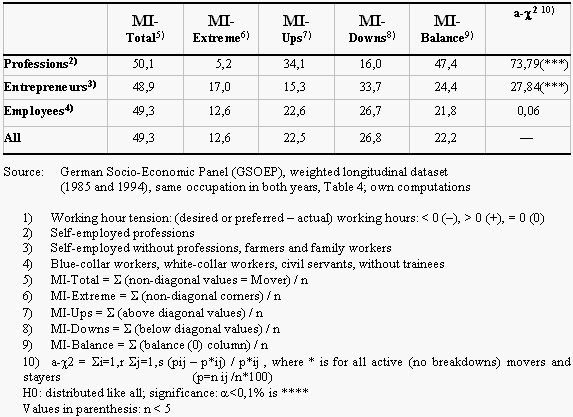
Table 4b deepens the transition analysis with a broader set
of mover indices. In addition, we construct a chi-square statistic to ask for
the significance of the occupational transition differences. Compared to
MI-total with all movers, MI-extreme with non-diagonal corners, MI-ups and
MI-downs with above and below diagonal elements and MI-balance with movers to
wht=0, specific cells of the transition tables are regarded with Table 4a
respectively.
The pronounced results: The most extreme movers can be found
within the entrepreneurs, most ups are for professions, most downs for
entrepreneurs and most movements to balance are visible for the professions.
The last column of Table 4b represents chi-square values
which here compares the respective socio-economic group situation to the overall
situation incorporating all transition cells. It becomes obvious that
professions and entrepreneurs and professions in particular - show a significant
different transition behaviour compared to the general picture which is
dominated by the employees situation.
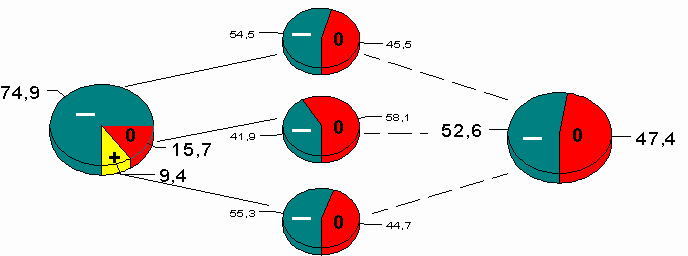
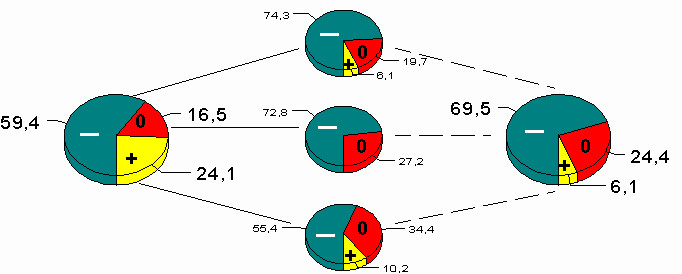
4.2 Further Transitional Aspects for Professions, Entrepreneurs and Employees
The starting situation, the final situation ten years after
and the transitions in between are put together in Figure 2 with additional
information mover/stayer information for each transition cell. The overemployed
situation (wht<0) is remarkably growing for employees and entrepreneurs with
dominant movements to a negative working hour tension from all three states.
With almost 70%, entrepreneurs are the most overemployed in 1994. Employees have
the highest balanced share in 1985. Ten years later they have the lowest
balanced share stressing the unsatisfied situation with their working hour
situation.
Again, dramatic changes are for professions: whereas in 1985
three of four (74,9%) professions wanted to work less this relation diminishes
to almost one of two (52,6%) in 1994. The growing part of balanced professions
stems from all of the three states with a certain dominance of those who are
balanced yet in 1985.
Many further specific transitions are available from Figure 2
further emphasizing the drawn picture of the socio-economic group differences.
5 What Explains the Working Hour Tension: Paneleconometric Estimates
Our descriptive analyses have already shown a lot of differences with regard to different socio-economic groupings like the occupational status and gender. More or less single effects could only be analyzed via two or threedimensional tables. A multivariate analysis, of course, allows to distinguish between a large set of competing explanatory variables and approaches. A multivariate paneleconometric analysis, in addition, allows the intertemporal stochastic analysis and to investigate unobserved heterogeneity, which describes specific individual differences in productivity and skills.
Figure 2: Individual Longitudinal Changes in Working Hour
Tension
Professions 1985 Changes: 1985 to 1994 1994
Entrepreneurs 1985 Changes: 1985 to 1994 1994
Employees 1985 Changes: 1985 to 1994 1994
Source: German Socio-Economic Panel (GSOEP), weighted longitudinal dataset, own computations
The (intertemporal) neo-classical labour supply theory under quantitity constraints could be the underlying theoretical approach to investigate the working hour tension. Examples are the papers by Ham 1982, van Soest, Woittiez and Kapteyn (1989) and Osberg and Phipps 1993. We use this approach for the microeconometric analysis of over- and underemployment with specific estimation procedures (two stage one and two limit constraints) in a separate paper (Merz 2000).
5.1 The Paneleconometric Approaches: Pooled, Fixed and Random
Effects One and
Two Factor Models
In particular, we shall analyze the following paneleconometric specifications where the left hand side (yit) will be the working hour tension (wht=desired minus actual working hours), xit the set of explanatory variables, a , b , g the regression coefficients to be estimated and e it is the error term (individuals: i = 1,...,N; time: t = 1,...,T):
In the pooled model all observations are put together and the regression coefficients describe an overall influence with no specific time or individual aspect. The pooled model is simply estimated by Ordinary Least Squares (OLS).
The fixed effects model allows the control for unobserved heterogeneity which describe individual specific skills not captured by the observed variables. In our context we can interpret the individual specific regression coefficients estimated by the ten periods respectively as describing individual market and non-market productivity skills. The estimation procedure is Partitioned OLS.
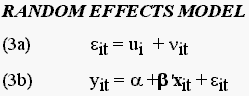
Within the random effects model the unobserved heterogeneity is captured by the error term consisting of an individual specific one and an overall component. This model will be estimated by Two Stage Feasible Generalized Least Squares (GLS).
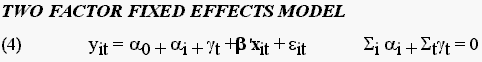
The above specifications are so called one factor models: one factor describe a specific effect. The two factor models will further disentangle the individual and time effects by separate coeffcicients. Within the fixed effects approach these two factors are the specific individual and time constant terms. Again, the estimation procedure is Partioned OLS.
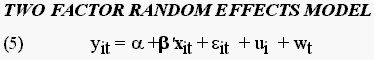
Within the two factor random effects model the two individual and time effects are captured by separate error components. Two stage feasible GLS will be the estimation procedure. All estimates are done with LIMDEP, Version 7.0 (Greene 1995), a powerful program package.
Our paneleconometric investigation strategy is as follows: after introducing a set of explanatory variables operationalizing different theoretical hypotheses, first we ask which model is the best one when estimating the male and female working hour tension. Then we separately estimate the working hour tension for professions, entrepreneurs and employees and analyze the respective wage elasticities. It might be expected, that over- and underemployment are different situations and has to be explained by different approaches. We therefore analyze these different situations by their explicit panelestimates. Finaly an overall two factor approach will be able to include individual-specific variables, such as sex, occupation, socio-economic background, which vary across individual units, but do not vary over time. In particular, we use this approach to incorporate the occupational status within the set of explanatory, right-hand side variables and investigate among others the competitive influence being a profession, entrepreneur or an employee.
5.2 The Set of Explanatory Variables: Market and Non-Market Influences
The German Socio-economic Panel (GSOEP) provides a large number of individual and household variables. Following in general the well proved human capital approach by Mincer and others within the labour supply approaches we concentrate on the following hypotheses and variables divided by personal and household characteristics.
Personal characteristics:
Besides age human capital will be expressed by the schooling variables Abitur (high school diploma) and a possible university diploma. We give specific attention to job experience variables and generate the recent job duration (months within the last two years) and the job duration within this firm (in years) describing specific non the job trained skills. In addition, we were able to compute the entire actual part-time and full-time experience (in years) from the end of schooling under consideration of all possible interruptions. Labour supply in form of our working hour tension might be influenced by the wage rate and the satisfaction about working hours seems to be of importance. Under the hypothesis that the market situation is the dominant part in investigating the working hour tension we regard time spent in non-market activities for housework, child care and Do-it-yourself (DIY) as exogeneous personal variables.
Household characteristics:
Following again a scarce modelling strategy and accounting for proven explanatory variables in many labour supply analyses our household characteristics encompass the household size, the number of children as indicators of household time consuming burden and a remaining household net income as household net income minus income gained by the person under investigation, as an indicator of economic needs for earning additional money.
5.3 Males and Females: Are there Genderspecific Differences
in Explaining the
Working Hour Tension?
Because of different roles within the family situation and in the society labour market behaviour might be different for males and females as it has been shown by many other microanalyses. Table P1 shows the results for the male and female separate estimates under different pooled, fixed and random effects model specification.
What is the best model?
Let us start to answer the question which one of these specifications is the best model? There are many indicators describing the best. We restrict our judgement for the present to goodness-of-fit measures, the non-adjusted and adjusted R2, and the value of the log-likelihood at the optimum. Results: for both male and female estimates the fixed model is superior to the pooled and the random effects model. With an adj. R2 of 67,6% (males) and 57,7% (females) the fit is remarkably good with respect to over 11.000 respectively 18.000 observations.
Specification tests: We use the likelihood ratio test for testing the fixed vs. the pooled model, the Breusch and Pagans Lagrange multiplier test for testing the random vs. the pooled model and the Hausman test for testing the fixed over the random effects model. Results: The large and significant chi2 values of the likelihood ratio test are in favour for the fixed compared to the pooled model. The large and significant Lagrange multiplier values are in favour for the random compared to the pooled model. So both, the fixed and random model which explicitly counts for the unobserved heterogeneity are both better than the pooled model: further unobserved market and non-market skills do count.
The Hausman test finally helps us to distinguish between the fixed and the random effects model: with large and significant values the fixed model is in favour compared to the random effects model. To summarize: goodness-of-fit as well the specification tests are in favour for the fixed effects model for males and females in explaining the working hour tension within the observed decade.
Further estimates with an first order autoregressive disturbance (AR1) specification to take into account further dynamics were not succesful because appropriate cells had almost no observations in many cases. Thus our panel data are too unbalanced for that type of modelling.
Table P1: Paneleconometric Estimates of Working Hour
Tension (Desired minus Actual Working Hours) 1985 to 1994,
Fixed Effects (Pooled, Random Effects) One Factor
Model,
Female, Male
|
Male |
|
|
Endogenous variable: |
||
|
Age |
-.86873 *** |
-.06582 |
|
Age**2 /100 |
.65043 *** |
-.33927 *** |
|
Abitur |
.00007 |
.00009 |
|
University diploma |
.00012 |
.00023 |
|
Market |
||
|
Job duration, last 2 years (m) |
-.00043 |
-.00120 |
|
Job duration, this firm (y) |
.00286 |
.00477 |
|
Part-time (Life) Experience (y) |
.18241 |
.19761 |
|
Full-Time (Life) Experience (y) |
.15178 |
.15343 |
|
Wage |
.18282 *** |
.12624 *** |
|
Work satisfaction |
.18442 *** |
.07263 *** |
|
Actual working hours (w) |
-.62168 *** |
-.77341 *** |
|
Non-market |
||
|
Housework hours |
-.00323 |
-.00154 |
|
Child care hours |
-.29625 *** |
-.04401 |
|
DIY hours |
.05716 |
-.11871 ** |
|
Household characteristics |
||
|
Household size |
-.02804 |
-.01108 |
|
Number of children |
-.37238 ** |
.10890 |
|
Rest household net income /10 |
-.01787 *** |
-.00268 |
|
Constant |
fixed effects |
fixed effects |
|
n |
11313 |
18126 |
|
Fixed |
||
|
R2(%) |
64.8 (57.7) |
72.0 (67.6) |
|
log-likelihood |
-35108 |
-53853 |
|
Pooled |
||
|
R2(%) (adj. R2(%)) |
40.9 (40.8) |
52.9 (52.9) |
|
log-likelihood |
-38043 |
-58547 |
|
Random |
||
|
R2(%) |
40.1 |
52.4 |
|
Fixed vs. Pooled: LR-Test, chi2 |
1882 *** |
9388 *** |
|
Random vs. Pooled: LM-Test |
2082 *** |
4537 *** |
|
Fixed vs. Random: Hausman Test |
285 *** |
269 *** |
Level of significance: * (90%), ** (95%), *** (99%), Same
regressors for the Pooled Model and Random Effects Model; years(y), months(m),
weeks(w)
Source: German Socio-Economic Panel (GSOEP), waves 1985 (B)
to 1994 (K); own computations
Explaining the working hour tension
Following the best approach in Table P1 the regression coefficients of the fixed effects model are given with fixed effects for all individuals estimated by the ten perios of our analysis. As the overall explanatory power was different for male and females (better for males) the significance of the various personal and household characteristics are different for male and female: there is a different non-linear age influence: more of a u-type for women but invers for men showing more dissatisfaction in younger and older years for women and more in the mid-ages for men. The wage, work satisfaction (pos.) and the actual working hours coefficients (neg.) are of the same sign and significance level for both genders. Thus the larger the wage the larger is the difference between the desired and actual working hours of the overemployed persons. We shall come back to a further differentiation of the over- and underemployed situation with Table P4.
As it might be expected, the household situation is of different influence for men and women: The female negative significant regression coefficient of hours spent for child care indicates the desire to work less as well in the underemployed situation (desired>actual working hours) as in the overemployed situation (desired< actual working hours, wht<0). The financial situation of the entire household is influencing the female working hour tension: the greater the remaining household net income the less is the working hour tension, the more balanced is the working hour situation.
It is astonishing that neither for males nor for females schooling and on the job-training variables play an important role like it is known from the labour supply literature. Thus the working history seems to be of no overall importance in explaining the actual working hour tension.
5.4 Professions, Entrepreneurs and Employees: Are there
Specific Occupational
Differences in Explaining the Working Hour Tension?
Our descriptive analysis gave us the hint for a different behaviour with regard to the occupational status. To deepen the analysis and to ask, what are the specific influences behind, we run separate panel regressions for professions, entrepreneurs and employees. Table P2 show the female, Table P3 show the male results.
Again we tried different specifications as a pooled, fixed and random one factor model for the different genderspecific occupational groups. The result is shown in the lower part of Table P2 and P3. The goodness-of-fit and specification tests as in the pure gender case are in favour for the fixed effects model whose resulting coefficients are given in the upper parts of Tables P2 and P3.
The overall female and male picture (the All-column, which repeats the appropriate Table P1 coefficients) is mainly influenced by the dominant employee coefficients. Although the overall fit is best for entrepreneurs, professions and then employees (for both genders) the simple inspection of stars indicating the coefficients significance show that we find more significant explanation for employees. Whereas some work history indicators (part- and full-time experience for women, age for both genders) are of importance for employees these work and living historical influences are not important in explaining the working hour tension for the self-employed, professions and entrepreneurs. Wage and work satisfction is highly significant for employees but not for the self-employed. However, the level of actual working hours is significant for all occupations: the longer the actual working hours the larger is the gap between desires and the actual situation.
For females, not for males, the household situation (child care hours, number of children, remaining household net income) is important being satisfied with the paid working situation.
To summarize: the working hour tension for the self-employed
is mainly explained by their actual working load, whereas additional economic
and non-economic variables are important for employees. Thus time souvereignity
as expressed by the self-employed or employee status
Table P2: Paneleconometric Estimates of Working HourTension (Desired minus
Actual Working Hours) 1985 to 1994,
Fixed Effects (Pooled, Random Effects) One Factor Model,
Female, Occupational Status
|
All |
Professionals |
Entrepreneurs |
Employees |
|
|
Endogenous variable: |
||||
|
Age |
-.86873 *** |
5.2997 |
-1.0909 |
-.99802 *** |
|
Age**2 /100 |
.65043 *** |
-6.1006 |
.19065 |
.65058 *** |
|
Abitur |
.00007 |
.00232 |
-.00674 |
.00044 |
|
University diploma |
.00012 |
-.00893 |
.00345 |
.00034 |
|
Market |
||||
|
Job duration, last 2 years (m) |
-.00043 |
-.07134 |
.08660 |
.00026 |
|
Job duration, this firm (y) |
.00286 |
.07432 |
.35903 |
.00969 |
|
Part-time (Life) Experience (y) |
.18241 |
-1.1838 |
-.14877 |
.31074 ** |
|
Full-Time (Life) Experience (y) |
.15178 |
-1.5395 |
.36941 |
.27357 * |
|
Wage |
.18282 *** |
0.25143 |
-.08436 |
.21149 *** |
|
Work satisfaction |
.18442 *** |
-.06616 |
.23419 |
.17221 *** |
|
Actual working hours (w) |
-.62168 *** |
-.46608* |
-.60605 *** |
-.61634 *** |
|
Non-market |
||||
|
Housework hours |
-.00323 |
-.35900 |
.52392 |
-.02530 |
|
Child care hours |
-.29625 *** |
.02257 |
-.62330 |
-.22912 *** |
|
DIY hours |
.05716 |
-.96434 |
.71966 |
.10003 |
|
Household characteristics |
||||
|
Household size |
-.02804 |
-10.607 *** |
-1.5679 |
-.03059 |
|
Number of children |
-.37238 ** |
-.08604 |
.33557 |
-.50145 *** |
|
Rest household net income /10 |
-.01787 *** |
.21766 |
.74116 |
-.02053 *** |
|
Constant |
fixed effects |
fixed effects |
fixed effects |
fixed effects |
|
n |
11313 |
97 |
308 |
10498 |
|
Fixed |
||||
|
R2(%) |
64.8 (57.7) |
89.0 (64.8) |
82.6 (70.4) |
63.8 (56.2) |
|
log-likelihood |
-35108 |
-262 |
-1001 |
-32116 |
|
Pooled |
||||
|
R2(%) (adj. R2(%)) |
40.9 (40.8) |
60.6 (52.2) |
60.0 (57.7) |
37.2 (37.1) |
|
log-likelihood |
-38043 |
-324 |
-1129 |
-35009 |
|
Random |
||||
|
R2(%) |
40.1 |
60.4 |
59.2 |
36.1 |
|
Fixed vs. Pooled: LR-Test, chi2 |
1882 *** |
124 *** |
255 *** |
5787 *** |
|
Random vs. Pooled: LM-Test |
2082 *** |
1 |
59 *** |
2077 *** |
|
Fixed vs. Random: Hausman Test |
285 *** |
29 ** |
10 |
301 *** |
Level of significance: * (90%), ** (95%), *** (99%), Same
regressors for the Pooled Model and Random Effects Model; years(y), months(m),
weeks(w)
Source: German Socio-Economic Panel (GSOEP), waves 1985 (B)
to 1994 (K); own computations
Table P3: Paneleconometric Estimates of Working Hour
Tension (Desired minus Actual Working Hours) 1985 to 1994,
Fixed Effects (Pooled, Random Effects) One Factor
Model,
Male, Occupational Status
|
All |
Professionals |
Entrepreneurs |
Employees |
|
|
Endogenous variable: |
||||
|
Age |
-.06582 |
1.0835 |
4.1825 |
-.05310 |
|
Age**2 /100 |
-.33927 *** |
-.17486 |
-1.2920 |
-.28193 *** |
|
Abitur |
.00009 |
-.00497 |
-.00071 |
.00025 |
|
University diploma |
.00023 |
.00591 |
-.00023 |
.00027 |
|
Market |
||||
|
Job duration, last 2 years (m) |
-.00120 |
-.07466 |
.00740 |
-.00106 |
|
Job duration, this firm (y) |
.00477 |
.11035 |
-.01370 |
.01066 |
|
Part-time (Life) Experience (y) |
.19761 |
-.62318 |
-1.8840 |
-.05534 |
|
Full-Time (Life) Experience (y) |
.15343 |
-.65444 |
-3.6495 |
.08536 |
|
Wage |
.12624 *** |
.07227 |
.08868 |
.12395 *** |
|
Work satisfaction |
.07263 *** |
.30365 |
-.03143 |
.08468 *** |
|
Actual working hours (w) |
-.77341 *** |
-.74803 *** |
-.84521 *** |
-.77790 *** |
|
Non-market |
||||
|
Housework hours |
-.00154 |
-.27501 |
.81156 |
-.00784 |
|
Child care hours |
-.04401 |
.91544 |
-.82969 |
-.06675 |
|
DIY hours |
-.11871 ** |
1.4971 |
-.59754 |
-.11839 ** |
|
Household characteristics |
||||
|
Household size |
-.01108 |
-2.3237 |
1.4364 * |
.05996 |
|
Number of children |
.10890 |
4.2015 * |
-.72350 |
.05489 |
|
Rest household net income /10 |
-.00268 |
.11248 * |
-.02413 |
-.00675 |
|
Constant |
fixed effects |
fixed effects |
fixed effects |
fixed effects |
|
n |
18126 |
238 |
672 |
16699 |
|
Fixed |
||||
|
R2(%) |
72.0 (67.6) |
81.6 (69.1) |
79.5 (70.3) |
69.1 (64.2) |
|
log-likelihood |
-53853 |
-755 |
-2294 |
-48468 |
|
Pooled |
||||
|
R2(%) (adj. R2(%)) |
52.9 (52.9) |
53.1 (49.5) |
61.2 (60.2) |
47.0 (47.0) |
|
log-likelihood |
-58547 |
-866 |
-2508 |
-52983 |
|
Random |
||||
|
R2(%) |
52.4 |
51.3 |
60.9 |
46.4 |
|
Fixed vs. Pooled: LR-Test, chi2 |
9388 *** |
223 *** |
427 *** |
9029 *** |
|
Random vs. Pooled: LM-Test |
4537 *** |
18 *** |
38 *** |
4369 *** |
|
Fixed vs. Random: Hausman Test |
269 *** |
21 |
19 |
256 *** |
Level of significance: * (90%), ** (95%), *** (99%), Same
regressors for the Pooled Model and Random Effects Model; years(y), months(m),
weeks(w)
Source: German Socio-Economic Panel (GSOEP), waves 1985 (B)
to 1994 (K); own computations
is important in explaining the working hour tension with further differences and influences not given by typical labour supply factors according the status as a professional or as an entrepreneur.
5.5 Wage Elasticities on the Working Hour Tension of
Professions, Entrepreneurs
and Employees
One of the most discussed variables in economics are prices. Within the labour supply analyses the price of labour, the wage influence is in the focus of interest. Based on the estimated coefficients of Tables P2 and P3 (fixed effects model, female and male, occupational status) Table P4 shows the appropriate wage elasticities. They are calculated as the regression coefficient multpied by the grand mean wage divided by the grand mean working hour tension.
Table P4: Wage Elasticities Regarding the Working Hour
Tension (wht),
Paneleconometric estimates 1985 to 1994, Fixed Effects Models,
Female and Male, Occupational Status
|
Elasticities |
wht (h) |
|||
|
Female |
Male |
Female |
Male |
|
|
Overall |
-.5288 *** |
-4.11 |
||
|
All |
-.5348 *** |
-.4220 *** |
-3.63 |
-4.42 |
|
Professionals |
-1.0863 |
-.1466 |
-3.03 |
-9.41 |
|
Entrepreneurs |
.0827 |
-.0894 |
-9.56 |
-14.52 |
|
Employees |
-.670 *** |
-.4811 *** |
-3.42 |
-3.86 |
e (wht, wage) = b(wage) * grand
mean wage / grand mean wht
Interpretation: negative e : 1%
wage increase decreases wht by e %
(increases hours supplied (because of negative wht))
wht = desired - actual weekly working hours
Level of significance: * (90%), ** (95%), *** (99%)
Source: German Socio-Economic Panel (GSOEP), waves 1985
(B) to 1994 (K); own computations
In addition, Table P4 shows the grand mean of the weekly working hour tension: entrepreneurs have the strongest desire to work less, the strongest tension (male:-14,5 hours/week, female 9,6 hours/week). With 3,9 hours/week male employees have only a slight stronger tension than women with 3.4 hours/week.
As discussed wages are not significant for the self-employed men and women. However, wages are highly significant for the employees working hour tension. The interpretation of the negative signed elasticity is a sfollows: a 1% wage increase decreases the working hour tension by .67% for females respectively .48% for males. Thus, the female working hour tension is more wage elastic than its male counterpart.
In addition to the working hour tension interpretation, the wage elasticities can also be interpreted for the working hours supplied itself. Becaus of the negative grand mean working hour tension a 10% wage increase increases hours supplied by 7% (female) resp. 5% (male). The labour supply elasticities thus are positive for male and female, the substitution effect dominates the income effect within the decade from the mid 80s to the mid 90s.
5.6 Under- and Overemployed: Are there Different Explanatory Patterns?
So far our concern was to explain the working hour tension as a phenomenon of an unbalanced situation of desired and actual working hours. The question we now raise: are there differences with regard to an underemployed situation (wht>0, desired hours>actual hours) and an overemployed situation where somebody wants to work less than (s)he does (wht<0, desired hours<actual hours)? Are there differences in explaining a positive and negative stress? Is the unbalanced situation itself important? Table P5 shows the female and male panel regression results for the under- and overemployed situations.
Table P5: Paneleconometric Estimates Working Hour Tension
(wht) 1985 to 1994,
Fixed Effects (Pooled, Random Effects) Model,
Female and Male, Under and Overemployment
|
Female |
Female |
Male |
Male |
|
|
Endogenous variable: |
||||
|
Age |
-.88388 |
-.82098 *** |
-.12888 |
.39830 **(*) |
|
Age**2 /100 |
.24845 |
.94746 *** |
.03238 |
-.58702 *** |
|
Abitur |
.00265 |
-.00039 |
.00093 |
-.00017 |
|
University diploma |
-.00023 |
-.00032 |
.00016 |
.00008 |
|
Market |
||||
|
Job duration, last 2 years (m) |
.00244 |
.00038 |
-.00097 |
-.00181 (*) |
|
Job duration, this firm (y) |
.14507 * |
-.01198 |
-.06836 |
.03634 * |
|
Part-time (Life) Experience (y) |
.47404 |
.13005 |
-.99747 * |
-.19396 |
|
Full-Time (Life) Experience (y) |
-.20522 |
.20394 |
-.36160 |
.14712 |
|
Wage |
.10093 |
.10006 *(*) |
.16053 *** |
.01101 |
|
Work satisfaction |
.01110 |
.19909 *** |
-.00406 |
.06384 * (*) |
|
Actual working hours (w) |
-.48257 *** |
-.54982 *** |
.46568 *** |
-.75979 *** |
|
Non-market |
||||
|
Housework hours |
.08672 |
-.09699 * |
.26195* |
.01266 |
|
Child care hours |
-.15263 |
-.28594 *** |
-.08303 |
-.00616 |
|
DIY hours |
-.42299 |
-.03933 |
.02592 |
-.14386 ** |
|
Household characteristics |
||||
|
Household size |
.32696 |
-.22000 |
-.22306 |
.04683 |
|
Number of children |
-1.1777 * |
-.26222 |
-.24138 |
.13749 |
|
Rest household net income /10 |
-.03400 |
-.00557 |
.00775 |
-.00573 |
|
Constant |
fixed effects |
fixed effects |
fixed effects |
fixed effects |
|
n |
1373 |
6090 |
2133 |
10961 |
|
Fixed |
||||
|
R2(%) |
80.6 (56.6) |
66.0 (54.6) |
87.4 (75.8) |
75.7 (69.4) |
|
log-likelihood |
-3691 |
-18008 |
-5354 |
-30853 |
|
Pooled |
||||
|
R2(%) (adj. R2(%)) |
31.5 (30.7) |
33.3 (33.1) |
47.7 (47.2) |
56.0 (56.0) |
|
log-likelihood |
-4562 |
-20063 |
-6876 |
-34102 |
|
Random |
||||
|
R2(%) |
31.2 |
32.8 |
47.2 |
55.7 |
|
Fixed vs. Pooled: LR-Test, chi2 |
1742 *** |
4108 *** |
3044 *** |
2246 *** |
|
Random vs. Pooled: LM-Test |
204 *** |
1009 *** |
489 *** |
2103 *** |
|
Fixed vs. Random: Hausman Test |
39 *** |
92 *** |
83 *** |
111 *** |
Level of significance: * (90%), ** (95%), *** (99%), Same
regressors for the Pooled Model and Random Effects Model; years(y), months(m),
weekly(w), d=desired, a=actual working hours
Source: German Socio-Economic Panel (GSOEP), waves 1985 (B)
to 1994 (K); own computations
Again the fixed effects model is superior (goodness-of-fit
and specification tests) to the pooled and random effect model. And again, the
overall explanatory power is remarkable and better for the male estimates.
To give a short answer to the above question: yes, for both
genders there are different influences within the personal and household
characteristics.
Let us start with the female situation: schooling and job
history is of (almost) no importance, but age is influencing the overemployed
situation, not the underemployed one. The desire to work less is influenced by
the non-market situation with housework and child care hours. The workplace
satisfaction is important for the overemployed only. Wage and the financial
situation are not important for the underemployed women: other than economic
reasons are driving female labour supply (in general) in the situation to work
more (see also Merz 1990).
The male situation is as follows: as for women age is only
important for the overemployed situation. There are no schooling and only minor
work history influences for both tension situations. The wage influence differs
compared to the womens situation: the wage rate is important for the
underemployed men: a higher wage strength the desire to work even more; wage is
highly incentive. However, for those who wants to work less than they do, age,
the actual working hours and the non-market DIY-activities are significant in
explaining the working hour tension.
5.7 A Global Approach: Results of the Random Effects Two Factor Panel Model
Because of their expected and proved specific importance we estimated and discussed above separate regressions for male and female and professions, entrepreneurs and employees. Though we could trace the group-specificic pattern, however, an overall approach with competing group-specific influences is missing. We therefore conclude the paneleconometric section with such an overall approach which allows us to discuss the relative importance of the socio-economic groups in an enhanced and overall encompassing approach.
The appropriate paneleconometric approach to capture non-varying variables, too, is the two factor panel model. This model has an overall constant as well as an individual effect for each individual and a time effect for each period. The problem of multicollinearity the time and individual dummy variables both sum to one is avoided by imposing the restriction that each of them sum up to zero.
The superior resulting estimated model now is a random effects two factor model with separate male and female and under- and overemployed estimates (Table P6). The non-varying variables are the occupational ones: professions, entrepreneurs and employees.
The first result: male under- and overemployed working hour tension are better explained (R2) than the female regressions. The size of R2 indicates that our explanation approach is comparably good. So, let us start with the male situation. We again see the discussed influences by age, job duration (this firm), job lifetime experience, wage, work satisfaction, actual working hours and some non-market household influences by DIY, number of children and the lasting financial situation of the household.
One striking result with regard to the relative importance of
the occupational status is the difference between the under- and overemployed
situation: there are significant differences by occupation for the overemployed;
significant differences are also found for the underemployed. In general,
professions and entrepreneurs, the self-employed, have a stronger desire to work
more than they do within the decade under investigation. The employees,
however, even in the underemployed situation and compared to the self-employed
want to reduce their labour
Table P6: Paneleconometric Estimates Working Hour Tension (wht) 1985 to 1994,
Random Effects Two Factor Model
with Professions, Entrepreneurs, Employees,
Female and Male, Under- and Overemployment
|
Female |
Female |
Male |
Male |
|
|
Endogenous variable: |
||||
|
Age |
-.17723 *** |
-.14754 *** |
-.25429 *** |
-.07280 *** |
|
University diploma |
-.00124 *** |
-.00117 *** |
.00007 |
.00023 |
|
Market |
||||
|
Job duration, last 2 years (m) |
.00205 |
-.00014 |
-.00182 |
-.00042 |
|
Job duration, this firm (y) |
-.04788 |
.01358 |
-.12072 *** |
.01979 ** |
|
Job (Life) Experience (y) |
.07553 ** |
.06182 *** |
.14911 *** |
.06884 *** |
|
Professions |
-4.4844 ** |
1.2670 |
5.6269 *** |
-.45507 |
|
Entrepreneurs |
-1.2399 |
1.4498 ** |
5.4199 *** |
-.09258 |
|
Employees |
-3.7433 *** |
.61931 |
-1.1682 * |
-.01437 |
|
Wage |
.19900 *** |
.16240 *** |
.16509 *** |
.03429 *** |
|
Work satisfaction |
-.05822 |
.14616 *** |
.02496 |
.11014 *** |
|
Actual working hours (w) |
-.34317 *** |
-.48317 *** |
-.47712 *** |
-.71734 *** |
|
Non-market |
||||
|
Housework hours |
-.04948 |
-.11644 **(*) |
.06364 |
.01619 |
|
Child care hours |
-.12678 * |
-.29199 *** |
-.09152 |
-.01976 |
|
DIY hours |
-.21939 |
-.17071 (*) |
.09357 |
-.16143 *** |
|
Household characteristics |
||||
|
Household size |
.95416 *** |
-.10163 |
.01730 |
.063757 |
|
Number of children |
-1.6434 *** |
-.58090 *** |
-.11885 |
.18260 * |
|
Rest household net income /10 |
-.06926 *** |
-.00997 |
-.00613 |
-.01042 ** |
|
Constant |
24.154 *** |
11.666 *** |
30.273 *** |
23.863 *** |
|
n |
1373 |
6090 |
2133 |
10961 |
|
Random v(i,t) = e(i,t) + u(i) |
||||
|
R2(%) |
32.6 |
30.0 |
48.3 |
55.8 |
|
Estd. Autocorrelation of e(i,t) |
-.24016 |
-.10761 |
-.23777 |
-.14000 |
|
Pooled |
||||
|
R2(%) (adj. R2(%)) |
32.8 (31.9) |
31.1 (30.9) |
49.1 (48.7) |
56.1 (56.0) |
|
Random vs. Pooled: LM-Test |
192 *** |
1076 *** |
495 *** |
2049 *** |
Level of significance: * (90%), ** (95%), *** (99%), years(y), months(m),
weekly(w), d=desired, a= actual working hours
Source: German Socio-Economic Panel (GSOEP), waves 1985 (B)
to 1994 (K); own computations
supply. Thus, it is important not only to look to the overall working hour tension situation but carefully to differentiate between these two states of unbalance.
Whats about the female situation? Again, for both situations we have significant age and schooling influences, job lifetime experiencees which count, the wage and actual working hours situation, and a broader compared to men influence of non-market and household influence. However, there is not such a clear cut difference between the under- and overemployed with regard to the occupational status as for men: The occupational status is important for both under- and overemployed women. Female entrepreneurship determines overemployment compared to professions and employees. Female professions and employees diminish the underemployed working hour tension.
Alltogether our paneleconometric analyses have shown
6 Concluding Remarks: Some Economic Policy Implications
With our microanlyses of the working hour tension of the gap between desired and actual working hours based on ten years paneldata we could detect a lot of interesting results and differences with regard to the gender situation and the employment as professions, entrepreneurs and employees. Overall the tension has raised to more than 62% in the mid 90s who want to work less (overemployed). Though the economic situation was going to be tougher within the decade from the 80s to the mid 90s and may be thats why stress has growing the majority of the active people would like to work less although they would diminish their earnings (see also Schramm and Schlese 1995).
Thus, there seems to be an even growing space allowed by the active people for shortening the working hours in favour for an employment of the unemployed (Büssing and Seifert 1995 discuss policy aspects of working hours arrangements).
In addition, our paneleconometric analyses have elaborated significant factors on the personal and household level in explaining the sign and the magnitude of the working hour tension. Overall, there are remarkable differences with respect to the time souvereignity of the active persons as self-employed or not. In particular, professions were able to harmonize their desires and their actual working situation over a ten years period.
To be more general: the economic well-being discussion is still concentrated first of all on the money aspect of inequality and welfare. Empirical evidence has shown, that the time aspect connected with many dimensions of living condition satisfaction is important to describe the individual well-being. As we have shown, dissatisfaction/satisfaction with labour market working hours is unequal distributed and has different importance for many socio-economic groups. Time and economic well-being, therefore, should be the allied package for individual welfare analyses in the future.
References
Burkhauser, R. and G. Wagner (1996), The English Version of the German Socio-Economic Panel, Syracuse University Discussion Paper, Syracuse
Büssing, A. and H. Seifert (eds.) (1995), Sozialverträgliche Arbeitszeitgestaltung, München
Garhammer, M. (1994), Balanceakt Zeit: Auswirkungen flexibler Arbeitszeiten auf Alltag, Freizeit und Familie, Edition Sigma, Berlin
Greene, W. (1993), Econometric Analysis, 2nd edition, New York
Greene, W. (1998), LIMDEP Version 7, New York
Ham, J. C. (1982), Estimation of a Labour Supply Model with Censoring Due to Unemployment and Underemployment, Review of Economic Studies, 69, 335-54
Holst, E. and J. Schupp, J. (1994), Ist Teilzeitarbeit der richtige Weg? Arbeitszeitpräferenzen in West- und Ostdeutschland, DIW-Wochenbericht 35/94, 618-26
Hsiao, C. (1986), Analysis of Panel Data, New York
Merz, J. (1990), Female Labor Supply: Labor Force Participation, Market Wage Rate and Working Hours of Married and Unmarried Women in the Federal Republic of Germany - The Influence of Occupational Career, Transfers and Socio-Economic Variables Based on the Socio-Economic Panel, in: Jahrbücher für Nationalökonomie und Statistik, 240-70
Merz, J. (1993), ADJUST - Program Package for the Adjustment of Micordata by the Minimum Information Loss Principle, Program Manual, FFB-Dokumentation Nr. 1e, Forschungsinstitut Freie Berufe, Fachbereich Wirtschafts- und Sozialwissenschaften, Universität Lüneburg
Merz, J. (1994), Microdata Adjustment by the Minimum Information Loss Principle, FFB-Diskussionspapier Nr. 10, Forschungsinstitut Freie Berufe, Fachbereich Wirtschafts- und Sozialwissenschaften, Universität Lüneburg, Lüneburg
Merz, J. (2000), Over- and Underemployment: Labour Supply Estimation With Quantity Constraints A Microeconometric Analysis for Germany, forthcoming
Merz, J. and M. Ehling (1999), Time Use Research, Data and Policy, Baden-Baden: Nomos Verlagsgesellschaft
Merz, J. and R. Lang (1997), Neue Hochrechnung der Freien Berufe und Selbständigen im Sozio-ökonomischen Panel, FFB-Dokumentation Nr. 5, Fachbereich Wirtschafts- und Sozialwissenschaften, Universität Lüneburg, Lüneburg
Merz, J. and R. Lang (1999), Working Hour Tension Dynamics Professions, Entrepreneurs and Employees in a Ten Years Panelanalysis of Desired vs. Actual Working Hours Incorporating Non-Market Influences, in: Merz, J. and M. Ehling, Time Use Research, Data and Policy, Baden-Baden: Nomos Verlagsgesellschaft, 241-68
Osberg, L. and S. Phipps (1993), Labour Supply with Quantity Constraints: Estimates From a Large Sample of Canadian Workers, Oxford Economic Papers, 45, 269-91
Schramm, F. and M. Schlese (1995), Beschäftigte wünschen auch in den Neunziger Jahren kürzere Arbeitszeiten, PERSONAL 11/95, 571-76.
Schupp, J. (1991), Erwerbsbeteiligung und Arbeitsmarkt, in: Rendtel, U. and G. Wagner (eds.): Lebenslagen im Wandel - Zur Einkommensdynamik in Deutschland seit 1984, Frankfurt a.M., New York, 89-113
van Soest, A., Woittiez, I. and A. Kapteyn (1989), Labour Supply, Income Taxes and Hours Restrictions in the Netherlands, Center for Economic Research, Tilburg University, Discussion Paper No. 8903
Wagner, G., Schupp, J. and U. Rendtel (1991), The Socio Economic Panel (SOEP) for Germany - Methods of Production and Management of Longitudinal Data, DIW-Dicussion Paper No. 31a, Berlin
Table 3b: Desired vs. Actual Working Hours 1985 and 1994 Distributional Aspects
|
1985 |
Working Hour Tension 4) |
1994 |
Working Hour Tension 4) |
||||||||||||||
|
N |
% |
< -25% |
-25 to 0% |
0% |
0 to 25% |
> 25% |
N |
% |
< -25% |
-25 to 0% |
0% |
0 to 25% |
> 25% |
||||
|
Gainful Employment |
21.025.587 |
100 |
19,5 |
36,6 |
31,9 |
5,4 |
6,6 |
28.894.480 |
100 |
15,4 |
47,0 |
21,3 |
11,3 |
5,0 |
|||
|
Professions 1) |
281.429 |
1,3 |
36,9 |
28,3 |
14,4 |
1,3 |
19,1 |
456.561 |
1,6 |
19,3 |
22,4 |
46,7 |
1,0 |
10,6 |
|||
|
part-time Ł 20 h |
77.076 |
27,4 |
(2,6)5) |
|
29,5 |
|
67,9 |
129.977 |
28,5 |
|
|
74,3 |
(3,4) |
22,2 |
|||
|
21 34 h |
11.730 |
4,2 |
(32,5) |
(56,0) |
|
|
(11,5) |
35.980 |
7,9 |
(19,1) |
|
(26,1) |
|
(54,7) |
|||
|
full-time 35 40 h |
23.613 |
8,4 |
(56,4) |
(8,4) |
(26,2) |
(9,1) |
|
99.858 |
21,9 |
(7,1) |
(12,0) |
80,9 |
|
|
|||
|
> 40 h |
169.010 |
60,1 |
50,1 |
42,0 |
(6,9) |
(1,0) |
|
190.746 |
41,8 |
38,9 |
47,3 |
13,8 |
|
|
|||
|
Entrepreneurs 2) |
1.282.660 |
6,1 |
36,7 |
29,2 |
22,1 |
4,6 |
7,3 |
1.325.590 |
4,6 |
40,6 |
27,4 |
20,4 |
2,7 |
8,9 |
|||
|
part-time Ł 20 h |
110.041 |
8,6 |
(5,7) |
|
31,4 |
|
63,0 |
198.211 |
15,0 |
(13,3) |
|
47,0 |
|
42,8 |
|||
|
21 34 h |
107.858 |
8,4 |
(9,8) |
(9,2) |
49,4 |
(18,2) |
(13,4) |
73.165 |
5,5 |
(16,6) |
(12,5) |
(59,2) |
(5,3) |
(6,4) |
|||
|
full-time 35 40 h |
130.851 |
10,2 |
(3,1) |
30,7 |
57,3 |
(8,9) |
|
95.922 |
7,2 |
(15,1) |
20,1 |
51,3 |
(13,0) |
|
|||
|
> 40 h |
933.910 |
72,8 |
48,2 |
34,7 |
13,0 |
3,0 |
(1,0) |
958.292 |
72,3 |
50,7 |
34,9 |
12,1 |
(2,0) |
(0,3) |
|||
|
Employees 3) |
19.461.198 |
92,6 |
18,1 |
37,2 |
32,8 |
5,5 |
6,4 |
27.112.329 |
93,8 |
14,1 |
48,3 |
20,9 |
11,9 |
4,8 |
|||
|
part-time Ł 20 h |
2.222.308 |
11,4 |
6,5 |
3,5 |
40,1 |
3,1 |
46,8 |
2.537.352 |
9,4 |
3,6 |
9,0 |
40,0 |
7,6 |
39,7 |
|||
|
21 34 h |
1.217.445 |
6,3 |
15,4 |
31,4 |
34,1 |
9,9 |
9,1 |
2.179.838 |
8,0 |
9,0 |
35,3 |
25,7 |
19,2 |
10,7 |
|||
|
full-time 35 40 h |
8.038.201 |
41,3 |
10,7 |
25,4 |
56,8 |
6,6 |
0,6 |
11.911.488 |
43,9 |
10,2 |
42,9 |
30,0 |
16,6 |
0,2 |
|||
|
> 40 h |
7.983.544 |
41,0 |
18,1 |
37,2 |
32,8 |
5,5 |
6,4 |
10.483.651 |
38,7 |
22,1 |
66,7 |
5,0 |
6,0 |
0,2 |
|||
|
Source: German Socio-Economic Panel (GSOEP), weighted
cross- n1994 = 6.331, N1994 = 28.894.480 |
1) Self-employed professions |
||||||||||||||||
--------------------------------------
1
Prof. Dr. Joachim Merz, University of Lüneburg, Department of Economic and Social Sciences, Research Institute on Professions (FFB), Campus Scharnhorststr. 1, Geb. 5, 21335 Lüneburg, Germany, Tel: +49 (0)4131/78-2051, Fax: +49 (0)4131/78-2059, e-mail: merz@ffb.uni-lueneburg.de, http://www.uni-lueneburg.de/fb2/ffbThe assistance of Dipl.-Volkswirt Rainer Lang and stud. rer. pol. Olaf Loest is gratefully acknowledged. The research for this paper is partly based on the project 'Time Use in Employment and Household Production - Dynamic Microanalyses with Paneldata', which was kindly reported by the German National Science Foundation (DFG).
An earlier version of this paper is given by Merz and Lang 1999. The extensions here are according to new descriptive as well paneleconometric results.
2 A recent survey on time use research topics and results is given by Merz and Ehling 1999.